
POSTED IN JUNE 27TH, 2014 IN INSIGHTS BY
I believe that it should be enough to encourage you to go to Google Analytics Academy and take GA for Beginners course. So, you can feel confident and comfortable while interacting with this platform.
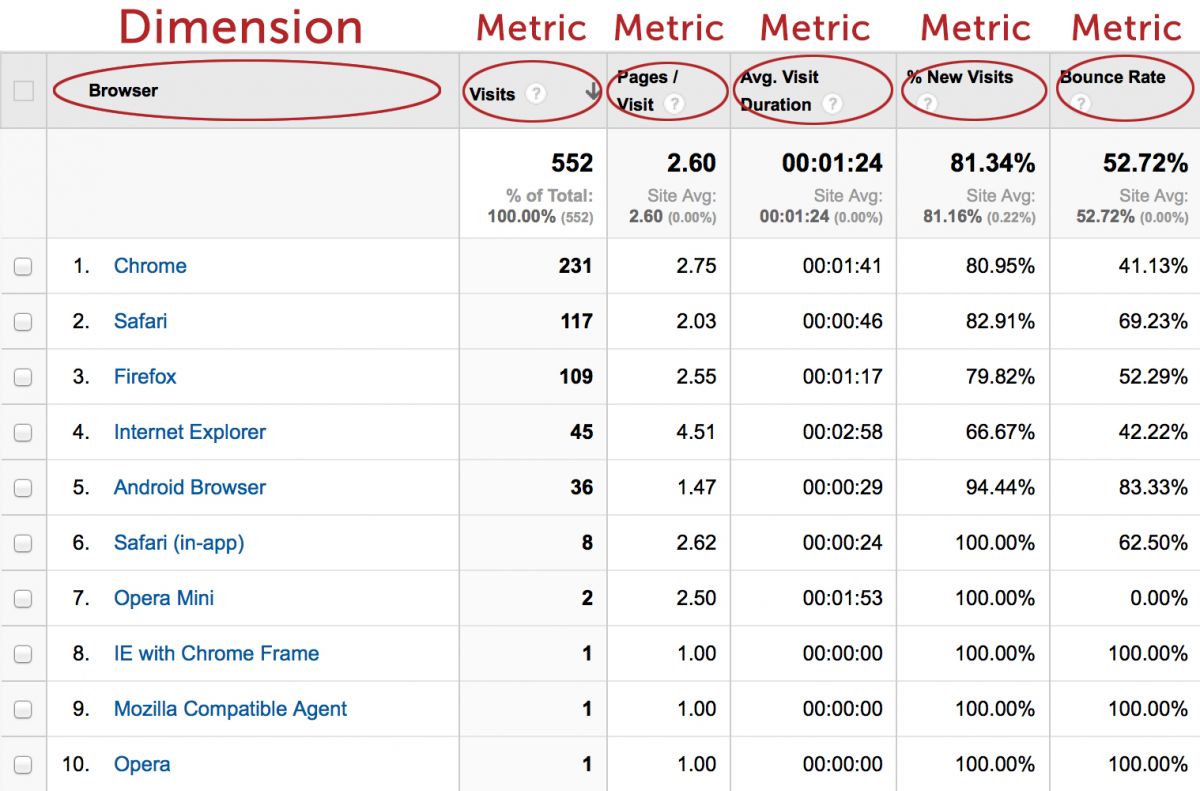
Every report in Google Analytics consists of dimensions and related metrics. In order to easier understand the definitions of both, I want to provide a short overview on dimensions and metrics, as well as share some examples on what they represent in Google Analytics.
Dimensions
Dimensions are attributes of data. For example, let's say a woman aged between 25-34 years from Toronto visited your website after clicking on a paid search ad, which she found by searching for a keyword "Machine learning courses" via Google Chrome browser. Let's assume that this browser is installed on her mobile device with operation system IOS.
So in this case our dimensions would be as highlighted below:
Gender - Female
In other words, dimensions are characteristics of your website users.
Metrics
Metrics are numbers in a data set often paired with dimensions. To be more precise, metric is used to measure a characteristic of a dimension. In Google Analytics a metric is presented as a total, average, or ratio of values.
It is noteworthy that not every metric can be combined with every dimension. The data makes sense only when the dimension scope matches the metric scope.
In the example below, I have provided some metrics and what they represent in Google Analytics:
I hope that this post will bring you more clarity on what metrics and dimensions are in Google Analytics. However, if you want to see more examples and clarifications on this topic, please visit Google Analytics Help.
Google Analytics is
a platform that collects data and organizes this
data into useful reports. By obtaining Google Analytics Individual Qualification certificate,
I have learned that Google Analytics allows you to track
the performance of your website traffic (or websites through cross-domain
function) and provides you with insightful reports.
I would definitely recommend to set up Google
Analytics to your website if you want to:
- track your conversion and business goal completions
- find
out which campaigns bring the most traffic and conversions to your website
- determine
the location of your best visitors
- visualize
what people click on the most
- learn
what people are searching for on your website
- identify
your best and worst performing pages
- determine
on which step in conversion path people are leaving
- discover
if you need a mobile application or site
- differentiate
new and returning visitors
- know
the source/medium of your traffic
- understand
who your customer are
- engage
people with your content
- see how
key metrics are fluctuating
I believe that it should be enough to encourage you to go to Google Analytics Academy and take GA for Beginners course. So, you can feel confident and comfortable while interacting with this platform.
But before you start I
want you to understand what the dimensions & metrics in Google Analytics
are.
Every report in Google Analytics consists of dimensions and related metrics. In order to easier understand the definitions of both, I want to provide a short overview on dimensions and metrics, as well as share some examples on what they represent in Google Analytics.
Dimensions
Dimensions are attributes of data. For example, let's say a woman aged between 25-34 years from Toronto visited your website after clicking on a paid search ad, which she found by searching for a keyword "Machine learning courses" via Google Chrome browser. Let's assume that this browser is installed on her mobile device with operation system IOS.
So in this case our dimensions would be as highlighted below:
Gender - Female
Age -
25-34
City -
Toronto
Source/Medium -
Google/Paid Search
Keyword - Machine
learning courses
Browser -
Google Chrome
Device Category -
mobile
Operating System -
IOS
In other words, dimensions are characteristics of your website users.
Metrics
Metrics are numbers in a data set often paired with dimensions. To be more precise, metric is used to measure a characteristic of a dimension. In Google Analytics a metric is presented as a total, average, or ratio of values.
It is noteworthy that not every metric can be combined with every dimension. The data makes sense only when the dimension scope matches the metric scope.
In the example below, I have provided some metrics and what they represent in Google Analytics:
- “Sessions”
are the total number of sessions in the given period of time.
-
“Users” are the total number of users that visited your
website.
-
“Pageviews” are the total number of views of a page that are
being tracked by the Google Analytics tracking code.
-
“Pages per session” is the average number of pages viewed
during each session.
-
“Average session duration” is the average length of a session
based on your site's visitors during a particular period of time.
-
“Bounce rate” is the percentage of users who left your
website after viewing a single page without any interactions.
-
“Percent of new sessions” is the percent of total users who
have visited your website for the first time in the selected date range.
I hope that this post will bring you more clarity on what metrics and dimensions are in Google Analytics. However, if you want to see more examples and clarifications on this topic, please visit Google Analytics Help.
Comments
Post a Comment